You can also find school performance information using the “Find and Compare Schools in England” service on the Department for Education website, commonly referred to as school and college performance tables.
School Data Summary 2023-2024
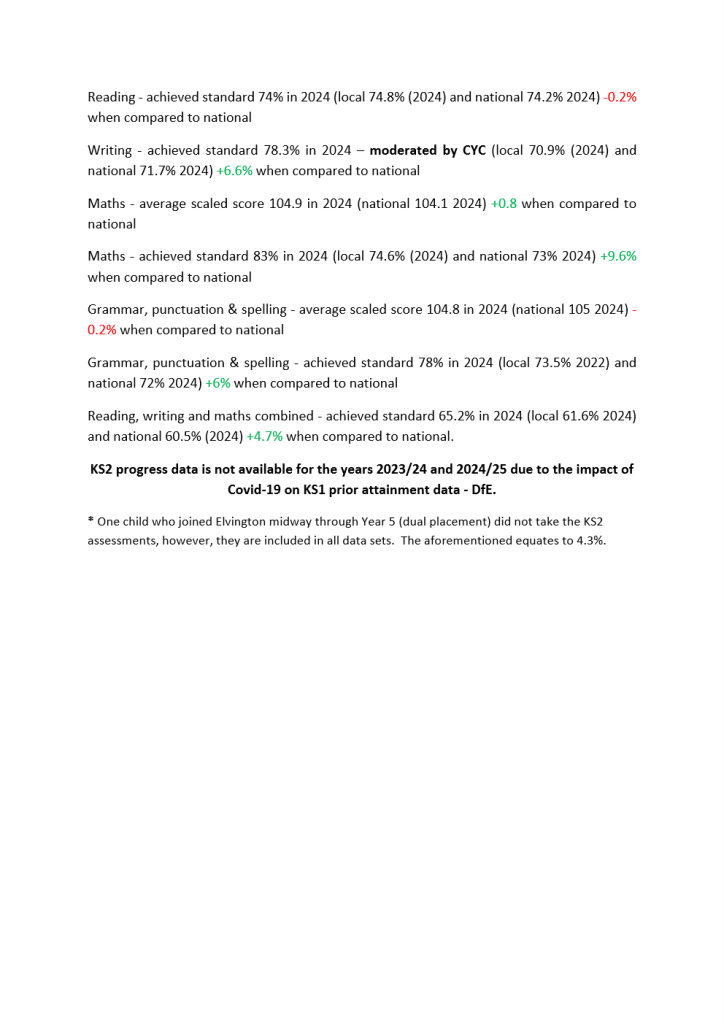
We are very proud to be able to share with you our end of key stage data for the academic year 2023-24. Our children have achieved wonderful results throughout school.


Due to the impact of the COVID-19 pandemic, most exams and assessments did not take place in 2019/20 or 2020/21 and the Government announced that it would not publish school or college level results data in autumn 2020 or autumn 2021. Information on what this means for the way school and college accountability operate for 2019/20, 2020/21 and 2021/22 can be found here. KS2 progress data is not available for the years 2023/24 and 2024/25 due to the impact of Covid-19 on KS1 prior attainment data.
- Data Summary 2022-23 as a .pdf
- Data Summary 2021-22 as a .pdf
- Data Summary 2020-21 as a .pdf
- School performance Data 2019
- School Performance Data 2018
- School Performance Data 2017
- Pupil Results 2016 – Letter to Parents
- Pupil Results 2015 Parent Booklet
- Pupil Results 2014 Parent Booklet
- Pupil Results 2013 Parent Booklet
- Pupil Results 2012 Parent Booklet
For the Key Stage 2 data, a scaled score of 100 indicates meeting the expected standard. A scaled score of 110 indicates a higher score or greater depth. Progress scores are centred around 0. A score of 0 means pupils in this school, on average, do about as well at Key Stage 2 as those with similar prior attainment nationally. A positive score means pupils in this school on average do better at Key Stage 2 than those with similar prior attainment nationally. A negative score does not mean that pupils did not make any progress between key stage 1 and 2. A negative score means they made less progress than other pupils nationally with similar prior attainment.

